|
3 September 2021 last updated |
 |
| Pension income recovers to levels before start of the lockdown |
 |
| |
Pension income has improved by 33.2% since October 2020 with higher equities and yields. |
|
|
|
|
|
Pension income has recovered to similar levels before the Covid-19 pandemic rising 33.2% since October 2020 as economic performance improves.
Income at retirement is influenced by the value of the fund and annuity rate at the time. The strong performance of the FTSE-100 index since the lockdown in March 2020 and recovery in annuities has seen pension income at retirement recover in the last year.
Our
benchmark example is based on a 65 year old in good health buying a lifetime
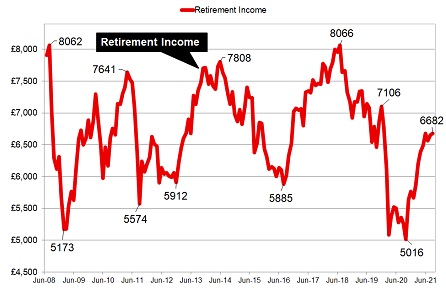
annuity on a single life and level basis. The chart shows how the 'buying power' of the fund has changed since July 2008 if you invested £100,000 at that time in a portfolio that reflects the FTSE-100 index.
Based on the chart, income from a pension fund in January 2020 was £6,776 pa and this decreased to £5,016 pa in October 2020. The pension income has now recovered 33.2% or £1,666 pa to the current level of £6,682 pa.
Find related news here:
Retirement income recovers 30pc as UK eases lockdown measures
Gilt yields fall as investors seek safe havens with spread of Delta variant
This chart shows how pension income at retirement has changed over time starting in July 2008 with a fund of £100,000. It assumes a portfolio tracks the FTSE-100 index over this period of time and shows the buying power of the fund over time. With rises and falls in fund value and annuity rates, this is the income that could be generated.
 |
| |
Benchmark annuity rates and FTSE-100 index |
|
| |
Mar |
Apr |
May |
Jun |
Jul |
Aug |
Sep |
| FTSE |
6,713 |
6,959 |
7,043 |
7,037 |
7,032 |
7,119 |
7,138 |
| Rate |
£4,999 |
£4,965 |
£5,000 |
£5,133 |
£5,049 |
£5,060 |
£5,065 |
|
Fig 1: Chart and table comparing retirement income from 2008 to 2021 |
Annuity rates are based mainly on the 15-year gilt yields and over time the value of equities in a pension fund rise and fall. The chart shows the buying power of £100,000 starting in July 2008 at £7,908 pa and this has changed significantly and exceeded the starting income in July 2018 with £8,066 pa.
Income reached low points in August 2016 after the result of the EU Referendum with income reducing to £5,885 pa and in March 2020 with income at £5,086 as lockdown was started due to the coronavirus pandemic.
The chart does not take account of inflation and shows that income does not keep up with the cost of living over time. In particular income from annuities has reduced since July 2008 when our benchmark example with a £100,000 pension fund produced an income of £7,908 pa.
Some thirteen years later this has reduced to £5,065 pa due to the fall in 15-year gilt yields falling from 4.83% in July 2008 to an all time low in March 2020 of only 0.162%. Since then yields increased to 1.14% by the end of February 2020 and are now at 0.93%.
The FTSE-100 index reached a low of 4,999 in March 2020 and has steadily increased over the last year and is fluctuating around 7,000 points since April this year and currently at 7,138.
Gilt yields could stay at current levels or increase based on the action taken by the Federal Reserve to start tapering the $120 billion bond purchases towards the end of 2021, according to central bank Chair Jerome Powell.
The Federal Reserve have stated that the US economy has satisfied the test of making 'substantial further progress' in terms of its inflation target and the employment has also seen 'clear progress', although it does not intend to increase interest rates in the short term.
Improving equity markets have increased the value of Pension funds and flexi-access drawdown plans although economic recovery is likely to be slow. The continued spread of the Delta variant coronavirus has reduced the availability of employees resulting in delays in supplying goods or even businesses closing outlets. This is likely to act as a drag on economic recovery in the medium term.
|
 |
|
|
|
|
|
| |
Age |
Single |
Joint |
|
 |
| |
55 |
£6,654 |
£6,281 |
|
|
| |
60 |
£7,014 |
£6,666 |
|
|
| |
65 |
£7,652 |
£7,219 |
|
|
| |
70 |
£8,619 |
£7,918 |
|
|
£100,000 purchase, level rates, standard
Unisex rates and joint life basis |
|
|
|
|
 |
| |
Plan your annuity and get quotes from the 12 leading providers |
|
| |
| |
 |
Free Annuity Quotes |
| |
|
No Obligation |
| |
|
From All Providers |
|
|
|
|
|
|
 |
|
|
| You can follow the latest annuity updates on Twitter or as a fan on Facebook |
 |
| |
 |
 |
|
|
|