|
| 17 May 2026 last updated |
 |
| Latest 15-Year Gilt Yields |
 |
Annuity rates are based on gilt yields and in particular the 15-year gilt yield is a key indicator of the likely direction for annuities in the future and should be followed by any pensioner retiring now.
Since the recent financial crisis developed in June 2008 investors have moved their funds to the safety of government bonds and gilts and this has increased the price thereby reducing the yields significantly. The impact on annuity rates has been dramatic although there are signs that gilts are now improving.
In the last six years yields reached a number of lows of 0.90% on 11 August 2016 following the Brexit vote in the EU Referendum and an all time low of 0.162% on 9 March 2020 due to the Coronavirus lockdown. It reached 5.29% on 9 April 2025, a sixteen year high as investors expected interest rates to be higher for longer.
Factors such as the Federal Reserve and the Bank of England changing interest rates will have an impact on annuities sending rates higher or lower.
|
|
|
| |
|
|
Gilt yields chart and data
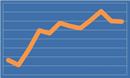 |
15-Year Gilt Yields
The 15-year gilt yields have a significant effect on annuity rates which we update regularly. |
Annuity rates are based on the 15-year gilt yields and are an important indicator of the likely direction for annuities. As a general rule a 20 basis point change (or 0.20% change in the actual yield) results in a 2.0% change in annuities.
The 15-year gilt yields increased by +15 basis points to 5.43% during April 2026 with providers of standard annuities increasing rates by an average +1.12% for this month and rates may rise by +1.86% in the medium term if yields remain at current levels.
For smoker and enhanced annuity providers have increased their rates by an average of +0.49% and rates may rise by +3.07% in the medium term if yields remain at current levels.
Find out more details:
Monthly analysis of annuities and gilt yields
Fig 2 below shows the daily 15-year gilt yield starting the month at 5.43% and the change from the previous day's close:
| 15-Year Gilt Yields - May 2026 |
| Day |
Rate (%) |
Change (bp*) |
| 1 |
5.38 |
-5 |
| 5 |
5.47 |
+9 |
| 6 |
5.35 |
-12 |
| 7 |
5.37 |
+2 |
| 8 |
5.31 |
-6 |
| 11 |
5.41 |
+10 |
| 12 |
5.52 |
+11 |
| 13 |
5.47 |
-5 |
| 14 |
5.43 |
-4 |
| 15 |
5.59 |
+16 |
| 18 |
|
|
| 19 |
|
|
| 20 |
|
|
| 21 |
|
|
| 22 |
|
|
| 26 |
|
|
| 27 |
|
|
| 28 |
|
|
| 29 |
|
|
|
| |
Table 1: Daily 15-year gilt yields and changes
* bp - basis points |
|
Table 1 above shows the 15-year gilt yields started the month at 5.43%. For the latest updates on how this affects annuities see Annuity Rates Outlook.
Economic events influencing gilt yields
Years 2025-26
Gilt yields soar to a high of 5.60% on 15 May 2026 due to the US-Iran war blockade of shipping in the Strait of Hormuz and after President Trump threatened further strikes on Iran to force them to make a deal. The blockade on shipping in the Straits of Hormuz has seen oil prices as high as $120 per barrel on 29 April 202 with higher inflation expected in the global economy.
Investors fear rising inflation and an energy crisis after the US and Israeli attacks on Iran on 28 February 2026. Iran drone strikes closing Qatar liquid natural gas production and threats on shipping in the Straits of Hormuz halts deliveries of oil sending the price of oil and gas to record levels for this year.
Investors expect lower inflation and interest rates as gilt yields reduce -29 basis points to 4.65% by the end of February 2026. The Bank of England is confident inflation will reduce to their 2% target by Spring this year helped by the energy price cap lowering by -7% in April 2026 and food prices now at the peak and expected to fall.
The Bank of England reduced interest rates in December 2025 by -0.25% from 4.0% to 3.75% following weaker economic data and inflation falling to 3.2% in November. After comments from Andrew Bailey that further cuts will be a closer call, gilt yields increased +10 basis points to 4.94%.
The Budget in Novemner 2025 revealed better than expected economic forecast and an improved fiscal headroom to £21.7 billion. This has satisfying investor concerns regarding stability for economic growth and as a result, gilt yields reduced -20 basis points to 4.84%.
Providers reduced enhanced annuity rates by an average of -2.68% as 15-year gilt yields fall 32 basis points in October 2025 to 4.81%, the lowest point in the last year. This is due to increased US-China trade tensions, poor US economic data and an expectation of lower US interest rates with investors seeking the safe havens of bonds and gilts.
Gilt yields rise to 5.28% in September 2025 with investor concern in the UK about the government's requirement to meet their fiscal rules with £30-50 billion of extra funding needed. This is despite Bank of England meeting reduced interest by -0.25% down to 4.00% in August 2025.
Annuity rates may reduce following weak economic data from the UK and US sending gilt yields lower by the end of July 2025. Investors now expect the Bank of England to lower interest rates by 0.25% at the next meeting on 7 August. Analysts give an 83% chance that the Federal Reserve will cut rates at the next meeting on 17 September.
President Donald Trump tariffs are less of a threat and gilt yields reduced as low as 4.86% in June 2025.
Gilt yields increased to a record high of 5.29% on 9 April 2025 after President Donald Trump started a trade war with a minimum 10% tariff on all countries. Higher extra tariffs were imposed on 60 countries including China with 145% tariffs on $145bn of goods and China imposing a 125% tariff on £440bn of US goods. With the US bond market in panic sell-off, Trump was forced to apply a 90-day suspension to the extra tariffs to avoid a market meldown.
In March gilt yields increased as high as 5.12% as Donald Trump introduces tariffs on Mexico and Canada and due to EU leaders backing an €800 billion defence plan.
The Bank of England reduced interest rates by -0.25% down to 4.50% in February 2025 with gilt yields ending the month slightly lower at 4.87%.
Gilt yileds reach a record high of 5.29% on 13 January 2025 due to fears Donald Trump will introduce tariffs adding to inflation and central banks forecasting fewer interest rate cuts for this year.
Years 2022-24
The 15-year gilt yields increased 46 basis points to the highest this year of 4.80% on 31 October 2024 due to the Budget and changes to the borrowing basis to public sector net financial liabilities. This allows the Chancellor to access a further £50 billion per year for infrastructure investments. Providers increased annuity rates in October by up to +5.8% as the Bank of England reduced interest rates by -0.25% to 4.75% on 6 November 2024 and are likely to keep interest rates higher for longer.
The US Federal Reserve cut interest rates by -0.5% on 18 September 2024 to a range of 4.75% to 5.00% and this is the first move in over four years.
The Bank of England cut interest rates by -0.25% to 5.0% on 1 August 2024. Interest rates reached a high of 5.25% twelve months ago and is falling after the Consumer Price Index (CPI) inflation reduced from a high of 11.1% in October 2022, down to 2.0% for May and June this year.
The European central bank (ECB) cut interest rates by 0.25% on 6 June 2024 from an all time high of 4.0% to 3.75%. The Bank of England is forecast to cut inetrest rates at the August 2024 meeting and this is likely to result in lower annuity rates.
Gilt yileds rise to a record high this year of 4.71% by 29 May 2024 as UK inflation reduces to 2.3% missing the forecase of 2.1%. US growth is higher than expected and poor Treasury aution demand sends government yields higher.
US consumer price index (CPI) inflation for March increases to 3.5% and Federal Reserve talk of higher interest rates sends 15-year gilt yields to a record high this year of 4.70% by 25 April. Analysts are expecting no more than two interest rate cuts from the Fed this year.
The Swiss central bank is the first to cut interest rates on 21 March 2024 by -0.25% to 1.5% as Swiss inflation reduces to 1.2%. Focus is shifting to other major central banks and the timing of rate cuts with the next expected from the European Central Bank in June 2024.
Gilt yields soar +50 basis points during the year to 4.45% by 29 February 2024 with providers increasing annuity rates. This is due to higher than expected inflation data in December 2023 from the US and UK suggesting interest rate will remain higher for longer.
Annuity rates end 2023 lower by -4.42% as gilt yields fall to 3.95%
reducing -118 basis points since the high of 5.13% in October. This is due to the Bank of England leaving interest rates unchanged and inflation falling to 3.9%, the lowest level in two years.
Gilt yields reached a high of 5.13% on 23 October 2023 as central banks state interest rates will be higher for longer as inflation remains resilient. Central banks have no increased interest rates in September and October and there may be are fewer increases expected with gilt yields falling to 4.32% by 6 December 2023. Annuity rates remain at a fourteen year high.
The 15-year gilt yields reached a record high for the year of 5.01% on 17 August 2023. With the larger fall in inflation for the US to 3.2% and in the UK to 6.8%, yields increased +37 basis points to 5.01% as investors expect interest rates to remain higher for longer.
Gilt yields reduce by -34 basis points from 4.13% by 28 February to 3.79% on 1 April 2023. This was due to investors seeking the safety of bonds and gilts due to the failure of US banks Silicon Valley Bank and Signature Bank and European bank Credit Swiss.
Gilt yields reached a high of 5.09% on 12 October 2022 rising 395 basis points over the year and since the appointment of Rishi Sunak as Prime Minister reduced to 3.85% or up 271 basis points.
Gilt yields have seen the biggest daily changes on record following the Mini Budget on 22 September 2022 rising 177 basis points this month from 3.19% to 4.96% a fourteen year high as investors were unconvinced the government can afford the proposed dramatic tax cuts.
Annuity rates increased dramatically by 12% and the Bank of England's intervention on 28 September 2022 to buy gilts in the next few weeks has steadied markets with yields falling by a record -73 basis points.
Investors shrug off global recession fears and expect higher base rates from central banks with 15-year gilt yields rising 87 basis points to 3.19% during August 2022 which is an eight year high. Annuity rates are expected to rise further and are now at an eleven year high.
Investors are concerned with the EU ban on Russian oil and the Federal Reserve will be more aggressive at increasing base rates in 2022 due to higher than expected US inflation which is the highest rate in the last 40 years. The 15-year gilt yields has increased to 2.42% by 3 June 2022, the highest level in seven years.
Years 2019-21
The Bank of England Governor Andrew Bailey indicated a rise in base rates later this year was possible due to inflation rising faster than expected at 4% which is twice the 2% long term target. The 15-year gilt yields have increased 32 basis points to 1.24% on 30 September 2021 and providers increase annuity rates.
Enhanced annuity rates rise over 6.0% as gilt yields increase 69 basis points reaching 1.23% by 31 March 2021. Investors expect a rise in long term inflation with stimulus and return to consumer spending when lockdown ends.
Gilt yields remain low at 0.40% in December 2020 as cases of Covid-19 rise across Europe and the US with record numbers recorded in the UK. A final Brexit deal with the EU sees a small bounce higher in yields but investors are more concerned with the uncertainty over the pandemic.
Federal Reserve are likely to hold rates at a record zero percent and support the economy until 2022 with a bond buying programme. In August 2020 the Fed statement intends to allow inflation to exceed 2% before applying monetary policy.
Yields bounced back as high as 1.13% in March 2020 due to the US intention to start their stimulus programme supporting the economy due to spreading Coronavirus.
Investors seek the safety of 15-year gilt yields falling 50 basis points reaching an all time low of 0.162% on 9 March 2020.
There are concerned with the potential slowdown in global growth caused by plunging oil prices due as Saudi Arabia and Russia price war and the spread of the Coronavirus.
15-year gilt yields reached a low of 0.566% on 3 September 2019 after concerns over a no-deal Brexit, the US-China trade tensions and fear of recession.
Gilt yields fall 28 basis points to 1.21% in May 2019 reaching the the lowest level since September 2016 and after the result of the EU referendum. Uncertainty with Brexit together with the US-China trade deal as both sides threaten higher tariffs has seen rising demand for treasury notes, gilts and bonds sending yields lower.
Uncertainty in March 2019 over Brexit sends investors to safety of government bonds and gilts increasing the price and lowering yields as much as 33 basis points to 1.28% with providers reducing rates for annuities by -2.54% on average for the month.
Continued geopolitical tension in January 2019 between the US and China with a fears of a slowdown in the US economy coupled with uncertainty over Britain's exit from the European Union and risk of a no deal is sending investors to the safety of gilts and bonds.
Years 2016-18
Investors are selling bonds and gilts sending 15-year gilt yields higher to 1.73% in September 2018. This could be due to Trump's $200 billion of trade tariffs on Chinese imports and the risk China could retaliate by selling its large Treasury bond holdings to push up the cost of US borrowing.
The 12 basis point recovery in yields during July 2018 was due to investors selling bonds around the world after Japan's central bank, the Bank of Japan, reviewed its monetary policy with the intention of reducing stimulus to increase inflation.
Concerns over Italy's political turmoil in May 2018 are driving investors to sell Italian bonds in faviour of safe havens such as US Treasury, German Bunds and UK gilts. The crisis has sent the 15-year gilt yields lower by 31 basis points from a high for the month of 1.81% to a low of 1.50%.
Figures show the UK economy in April 2018 are the weakest since 2012 with GDP at 0.1% for the quarter due to falling construction output and weak manufacturing figures lowering gilt yields and providers have reduced annuity rates for the month of May.
The 15-year gilt yields are down in March 2018 after Trump unveils $50 billion of trade tariffs on Chinese imports sending stocks lower and investors fear economic uncertainty and seek the safe havens of government bonds and gilts.
The 15-year gilt yields are up 25 basis points in January 2018 as investors expect a rise in interest rates from the US Federal Reserve in Mach and strong economic data for the US economy had seen investors selling bonds for other types of investments.
Gilt yields reduce by 13 basis points in December 2017 as investors were disappointed with the European Central Bank (ECB) President Mario Draghi statement that due to the low inflation rate stimulus measures would remain.
Interest rates rise by 0.25% on 2 November 2017. This is the first rise of interest rates since July 2007 from an all time low of 0.25% to their current level of 0.5%. The Bank of England has indicated future rises will be at a gradual pace and to a limited extent.
Gilt Yields increased by 26 basis points to 1.67% during September 2017 following the Federal Reserve and Bank of England's strongest indication yet that interest rates will rise in the autumn.
Increasing geopolitical tension in August 2017 between the US and North Korea over missile tests has seen investors seek safe havens such as gilts and bonds with the 15-year gilt yields reducing 18 basis points to 1.41%.
In July 2017 the US Federal Reserve delays increasing interest rates due to weaker than expected inflation. In addition investors have doubts over President Donald Trump’s pro-growth policy agenda with funds moving to bonds and gilts sending yields lower.
Yields were higher by 19 basis points to 1.62% during June with 24 basis points added in the last four days. The ECB President Mario Draghi stated the factors suppressing inflation are short term implying the €1.1 trillion quantitative easing (QE) programme would be stopped by the end of the year with investors selling gilts and bonds.
The yields for May were as high as 1.60% after Macron won the French election but soon headed south with concerns over Donald Trump's dismal of FBI Director James Comey followed by mixed economic data on US housing and industrial output.
Gilt yields reached a low of 1.37% in April down 51 basis points from the high of 1.88% reached in January 2017 due to geopolitical uncertainty after worries over the elections in France, the US conflict with Syria and tensions with North Korea send investors to safe havens of gilts and bonds.
The election of Donald Trump to US President in November 2016 has seen investors sell bonds and gilts increasing yields. The expectation is for higher infrastructure spending increasing inflation and the Federal Reserve raising interest rates.
In October 2016 a combination of factors is driving yields up to close at 1.61%, the highest level since the EU Referendum. Investors anticipate the Federal Reserve are likely to increase interest rates before the end of the year. The Bank of Japan and Europe Central Bank are reaching the limit of buying long-term government bonds and this is helping a sell off in bonds. OPEC are close to agreeing a deal to cut the supply of crude-oil which may see the price rise from the current level of $50 a barrel and this could push up inflation.
The 15-year gilt yields reached another all time low of 0.90% on 11 August 2016.
The Brexit vote has resulted in the 15-year gilt yields reducing by 52 basis points reaching an all time low of 1.41% on 30 June 2016. The governor of the Bank of England announced measures for a further £250 billion of Quantitative Easing (QE) should this be required and possible reduction in interest rates from the current all time low level of 0.5% since 2009.
Uncertainty over the 2016 EU Referendum and the possibility of a Brexit vote has seen investors seek the safe havens of bonds and gilts sending the prices higher and yields lower.
In April 2016 European Central Bank (ECB) President Mario Draghi has hinted on reducing deposit interest rates sparking a sell off of global bonds and a 14 basis point rise in the 15-year gilt yields.
Volatility in February due to fear of a global slowdown sends yields to a low of 1.68% before recovering back to 1.92%. In January 2016 the 15-year gilt yields reduced 36 basis points as investors seek safe havens following fears of over a slowdown in China and lower oil prices sending equity markets lower.
Years 2014-15
The Federal Reserve in October 2015 hinted on increasing interest rates in December sending yields 13 basis points higher to end the month at 2.23%.
Uncertainty with a Chinese economic slowdown and Federal Reserve unclear decision over interest rates in September sends yields to a lower level of 2.12%.
Yields have increased from the recent level of 1.97% to as high as 2.35% following investors dumping US Treasury notes, German Bunds and UK government gilts at the beginning of June 2015. This follows improved economic data from Europe and the Federal Reserve delaying an increase in interest rates until later in the year.
The 15-year gilt yields reduced by 98 basis from 2.66% at the end of October to 1.68% on 30 January 2015, the lowest ever level.
This was due to economic factors such the ECB is to starting a €1.1 trillion stimulus programme of quantitative easing buying corporate bonds and sovereign debt as well as uncertainty such as the falling oil prices, deflation in the Eurozone, poor economic data from China and high interest rates from Russia.
The Federal Reserve finally ended quantitative easing in November 2014, 6 years after it started tapering the $85 billion a month programme back in 2008. The 15-year gilt yields have not reacted to the announcement as the effect of no stimulus had been discounted by the market by December 2013 when yields reached 3.47%.
Increasing uncertainty in Ukraine over Russian intervention, conflict in the Middle East threatening military action from Western economies and the threat of deflation in the Eurozone requiring action from the ECB in the form of Quantitative Easing have seen investors transferring investments to safe havens. The 15-year gilt yields have reduced 51 basis points from 3.21% on the 4 July to 2.70% by 31 August 2014.
The Governor of the Bank of England Mark Carney has stated that interest rates will be kept at the current rate of 0.5% for some considerable time when the market expected rates to increase by the end of this year. The 15-year gilt yields reduced from from 3.20% to a low for this year of 3.03%.
Years 2011-13
In December 2013 the Federal Reserve reduced the $85 billion a month stimulus package by $10 billion to $75 billion after a series of positive US economic data sending prices for bonds lower and yields higher. The US Fed has since aimed to reduced the stimulus by $10 billion per month to the current level of $25 billion a month.
In August 2013 the US Federal Reserve announced tapering of the stimulus package resulting in a sudden fall in equity and bond markets and a rise in yields. With Bank of England fixing interest rates to 0.5% until mid 2016 with the "forward guidance" policy markets immediately ignored this with further rises in yields. As growth returns to the Eurozone investors are moving funds away from safe havens such as bonds and gilts helping yields higher.
Investor confidence was knocked in July 2013 after the US Federal Reserve announced the end of the $85 billion per month of stimulus known as Quantitative Easing. This decreased the price of bonds and gilts deflating a bubble building in the market. As a result the 15-year gilt yields increased significantly to the benefit of people retiring.
In January 2013 the US managed to negotiate a deal between President Obama and the Republican House of Representatives over the fiscal cliff to avoid the implementation of $600 billion of spending cuts and tax rises. This avoids the US heading back into recession and has boosted market confidence resulting with investors moving funds away from safe havens such as UK government gilts to higher yielding investments thereby reducing the price and increasing the yield of gilts. This is likely to increase annuity rates in due course.
Gilt yields decreased in July 2011 due to the UK government injecting £50 billion of funds into the economy using Quantitative Easing (QE) as well as investor fear over Spain's debt which resulted in their 10-year bond yields increasing to 7.66%. This is beyond the 7% level that would trigger a sovereign bailout as seen in Greece, portugal and Ireland.
At the end of October 2012 the Spanish yields had reduced to 5.5%.
Gilt yields stabilised as the European Central Bank (ECB) announced a plan to do "whatever it takes" to save the euro and buy sovereign debt of countries that need a bailout.
|
 |
|
|
|
|
|
| |
Age |
Single |
Joint |
|
 |
| |
55 |
£6,669 |
£6,388 |
|
|
| |
60 |
£6,991 |
£6,771 |
|
|
| |
65 |
£7,880 |
£7,392 |
|
|
| |
70 |
£8,678 |
£8,031 |
|
|
£100,000 purchase, level rates, standard
Unisex rates and joint life basis |
|
|
|
|
 |
| |
Plan your annuity and get quotes from the 12 leading providers |
|
| |
| |
 |
Free Annuity Quotes |
| |
|
No Obligation |
| |
|
From All Providers |
|
|
|
|
|
|
 |
|
|
| You can follow the latest annuity updates on Twitter or as a fan on Facebook |
 |
| |
 |
 |
|
|
|