|
15 February 2019 last updated |
 |
| Retirement income recovers as US stocks lead equity rally |
 |
| |
US stocks lead equity rally in FTSE-100 index and sees retirement income rise by 7.5% |
 |
|
|
|
|
Retirement income has recovered 7.5% since the FTSE-100 reached a recent low of 6,584 in December and benefited from the January 2019 rally of US stocks.
After maintaining a high during the summer last year, equity markets around the world started to fall in October with about $5 trillion in value wiped from the global stock and bond markets.
This was due to a complex mix of rising US interest rates, slowing growth in China and Italy's debt risk to Europe sending investors to the safety of bonds and gilts. Fears of a slowing Chinese economy could result in a downturn to the global economy helped by the US tariffs against China enhancing this outcome.
| |
Benchmark annuity rates and FTSE-100 index |
|
| |
Aug |
Sep |
Oct |
Nov |
Dec |
Jan |
Feb |
| FTSE |
7,432 |
7,510 |
7,128 |
6,980 |
6,728 |
6,968 |
7,236 |
| Rate |
£5,563 |
£5,520 |
£5,558 |
£5,563 |
£5,570 |
£5,571 |
£5,571 |
|
The above table shows providers have only made minor changes to annuity rates are over the last seven months and so people taking their benefits have not been subject to volatility in annuities.
For those that remain invested before taking their benefits, tracking the FTSE-100 index would see their pension fund rise 652 points from the recent low in December 2018 of 6,584 to 7,236 in February.
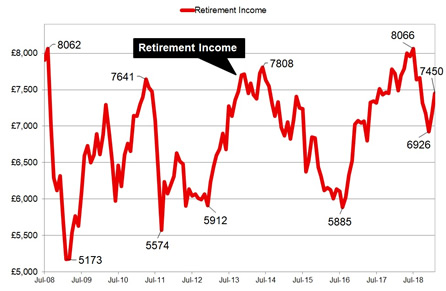
The income you can receive from a pension is based on the fund value and annuity rates at the time you take benefits. Our index chart of retirement income is based on a 65 year old with £100,000 buying a single life, level annuity. The chart assumes the fund is valued at £100,000 in July 2008 and invested in a fund that tracks the FTSE-100 index.
 |
| Fig 1: Chart comparing retirement income since July 2008 |
The above chart shows that in July 2008 a fund of £100,000 could provide an income of £7,908 pa and this decreased to an all time low after the financial crisis as equity markets crashed, reducing the fund and buying power to only £5,173 pa by February 2008, the lowest in the last ten years.
It reached an all time high in August 2018 of £8,066 before reducing to a recent low of £6,926 in December 2018 mainly due to the volatility in equity markets. The recovery seen in 2019 for our benchmark example has seen the income increase £524 pa.
Over the lifetime of the annuitant based on the Office of National Statistics (ONS) we would expect a male to live for 18.5 years. This would mean that a male will have £9,694 more over his lifetime and for a female she can expected to live for 20.9 years increasing her income by £10,951.
For those planning to take their benefits as an annuity, it could be a good time to capitalised on the February recovery before economic uncertainty and fears of a slowdown returns to the equity markets.
|
 |
|
|
|
|
|
| |
Age |
Single |
Joint |
|
 |
| |
55 |
£6,132 |
£5,784 |
|
 |
| |
60 |
£6,532 |
£6,234 |
|
 |
| |
65 |
£7,247 |
£6,808 |
|
 |
| |
70 |
£8,170 |
£7,616 |
|
 |
£100,000 purchase, level rates, standard
Unisex rates and joint life basis |
|
|
|
|
 |
| |
Plan your annuity and get quotes from the 12 leading providers |
|
| |
| |
 |
Free Annuity Quotes |
| |
 |
No Obligation |
| |
 |
From All Providers |
|
|
|
|
|
|
 |
|


|
| You can follow the latest annuity updates on Twitter or as a fan on Facebook |
 |
| |
 |
 |
|
|
|

