|
29 January 2018 last updated |
 |
| Retirement income up 33% since Brexit vote and highest for ten years |
 |
Retirement income is up 33% since the Brexit vote and a combination of rising equity markets and higher annuity rates means the income from a pension fund is at the highest for ten years.
Providers have increase annuities reaching the highest level since February 2016 and are up 18% since reaching an all time low after Brexit in August 2016.
Annuity rates are based mainly on the 15-year gilt yields
and our benchmark example of a 65 year old with £100,000 shows annuity rates have increased from the all time low of £4,696 pa to the current level of £5,546 pa.
For those that remain invested before taking their benefits, tracking the FTSE-100 index would see their pension fund rise from the recent low in February 2016 of 5,898 to 7,671 in January near to the indices all time high.
The combination of strong equity markets and higher annuity rates
have increased the income from our index chart by 33% since the low point reached in August 2016 after the Brexit vote.
|
|
 |
| |
Higher annuity rates and equity markets sends retirement income to the highest level for 10 years |
|
|
|
| |
|
Income is second highest for 10 years
The income you can receive from a pension depends on the growth in equity markets while accumulating your funds and annuity rates when you take your benefits.
Our index chart of retirement income is based on a 65 year old with £100,000 buying a single life, level annuity. The chart assumes the fund is valued at £100,000 in July 2008 and invested in a fund that tracks the FTSE-100 index.
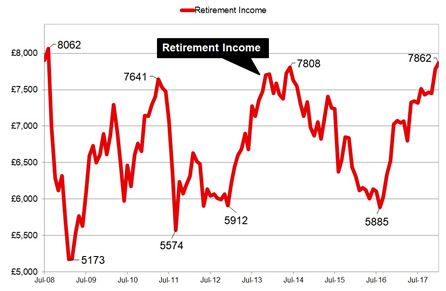 |
| Fig 1: Chart comparing retirement income since July 2008 |
The above chart shows that in July 2008 a fund of £100,000 could provide an income of £7,908 pa and this decreased to an all time low after the financial crisis as equity markets crashed, reducing the fund and buying power to only £5,173 pa by February 2008, the lowest in the last ten years.
The index chart shows the buying power of the original fund recovered to £7,641 pa in April 2011 and £7,808 pa in June 2014 before reducing to £5,885 pa in August 2016 following the Brexit vote when annuity rates reached an all time low.
| |
Benchmark annuity rates and FTSE-100 index |
|
| |
Jul |
Aug |
Sep |
Oct |
Nov |
Dec |
Jan |
| FTSE |
7,372 |
7,430 |
7,372 |
7,493 |
7,326 |
7,687 |
7,671 |
| Rate |
£5,370 |
£5,473 |
£5,473 |
£5,390 |
£5,503 |
£5,476 |
£5,546 |
|
For those invested before buying an annuity, a rise or fall in equities can make a significant difference to the income they can expect.
The combination of rising equity markets and annuity rates has seen the retirement income recover 33.5% or £1,977 pa since the low in August 2016. It is now at the second highest level of retirement income in the last 10 years of £7,862 pa.
Although annuity rates are 29.8% lower since July 2008, the FTSE-100 index has increased 41.7% and this would benefit those investing in flexi-access drawdown.
Over the lifetime of the annuitant based on the Office of National Statistics (ONS) we would expect a male to live for 17.3 years. This would mean he will have £34,202 more over his lifetime and for a female she can expected to live for 20.4 years increasing her income by £40,330.
For those planning to take their benefits as an annuity this could be a good time while the combination of annuity rates and equity markets are at a high.
|
| |
|
 |
|
|
|
|
|
| |
Age |
Single |
Joint |
|
 |
| |
55 |
£6,654 |
£6,281 |
|
|
| |
60 |
£7,014 |
£6,666 |
|
|
| |
65 |
£7,652 |
£7,219 |
|
|
| |
70 |
£8,619 |
£7,918 |
|
|
£100,000 purchase, level rates, standard
Unisex rates and joint life basis |
|
|
|
|
 |
| |
Plan your annuity and get quotes from the 12 leading providers |
|
| |
| |
 |
Free Annuity Quotes |
| |
|
No Obligation |
| |
|
From All Providers |
|
|
|
|
|
|
 |
|
|
| You can follow the latest annuity updates on Twitter or as a fan on Facebook |
 |
| |
 |
 |
|
|
|